Exciting New Enhancements to Custom Reports!
Easily organize and visualize your data from within GoCo to gain valuable HR insights.

by Marisol Getchell, Product Marketing Manager @ GoCo.io - December 12th, 2022
Extracting meaningful insights from your HR data should be simple. We know a lot of work goes into getting all of your data into a software solution. So, we think it should be easy for you to report on and learn from that data.
Custom reports have existed in GoCo for some time now -- with the ability to download as a CSV file or show in table view on the platform. While you could flexibly select what data was included in those reports, there was no easy way to manipulate it within GoCo.
In many cases, our clients had to download the report and import it into a 3rd party tool, like Microsoft Excel, in order to synthesize the data to get answers.
Until now 🎉
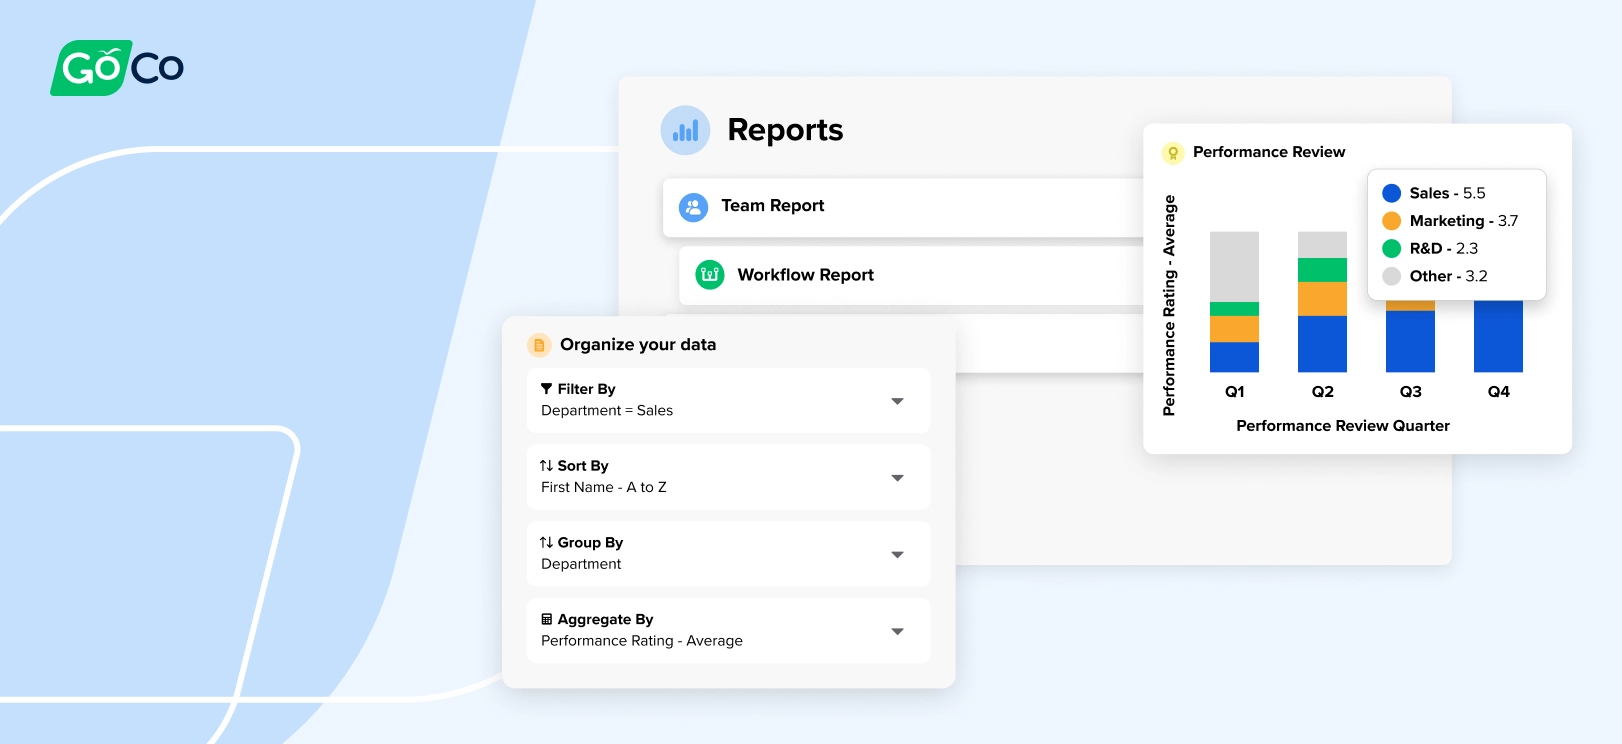
Since we’re all about flexibility here at GoCo, we’ve been enhancing our custom reports to give you more options. Our goal is to provide the tools needed for everyone to be able to pick and choose exactly what data is included in each report as well as new ways to organize and visualize it from within GoCo.
Here’s what’s new in GoCo Custom Reports: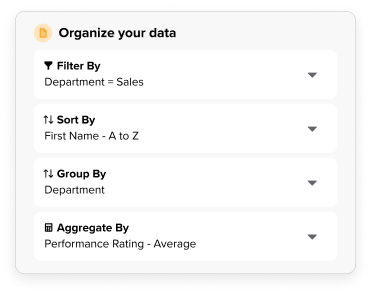
Grouping
Organizing information often starts with grouping data. New to custom reports is the ability to group rows of data together based on specific criteria. Grouping rows makes it easy to expand and contract sections of your data and emphasize the areas that you find most relevant.
Column Functions
Column functions go hand in hand with grouping. We’ve added the ability to apply specific aggregations to numerical columns, like sum, average, minimum, and maximum. This makes it easier to quickly synthesize and draw conclusions from large sets of numerical data.
Filtering & Sorting
We previously had a basic sorting setting, allowing you to order the report based on first or last name, A-Z or Z-A. With the new enhancements, we’ve opened up the options allowing you to sort the data by any column in the report. We’ve also added extensive filtering options, allowing you to filter the report by any data source (like employment status, department, location, etc.).
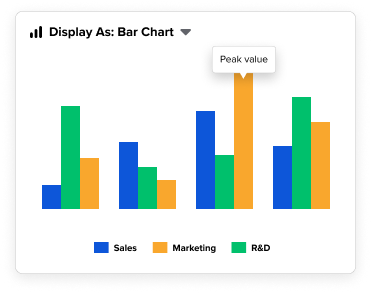
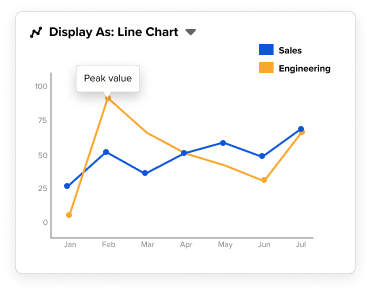
Charts
What good is your data if you can’t visualize it? We’re super excited about the seven new chart types we’ve added: pie, donut, bar, column, line, area and metric. All of these can be easily added into the report grid view, inside GoCo, so you can get a deeper understanding of your data at-a-glance.
 We know you will find value in these new capabilities. Team data is the foundation of the GoCo platform. We strive to empower HR teams to easily access and gain insights into that data from within GoCo. So, all of this new functionality is included in your Premium HR subscription.
Watch our Custom Reports demonstration from the What's New in GoCo Fall 2022 Webinar:
Book a meeting with a GoCo expert for a deeper dive into GoCo Reports. Or, if you’re a current customer, you can log in and start creating new custom reports today!
Recommended Posts

Sneak Peek: New Features for Fall 2022 Release
Blog Articles

Introducing GoCo's Performance Management!
Blog Articles

New App Integrations in the Marketplace!
Blog Articles
Search...
Product
GoCo
Resources
Articles
eBooks
Webinars
Customer Stories