HR Reports & Insights
Bring Your People Data to Life With Better Reports and Insights
Tracking and analyzing your people data is the first step to making more strategic people decisions. GoCo Reports makes it easy to access your data, uncover trends, and highlight meaningful insights in a matter of minutes
If You Can Dream It, You Can Report on It
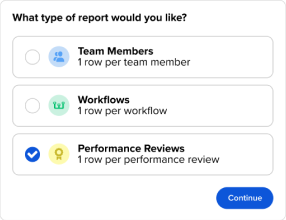
Pick any set of data from workflows, performance, custom fields, employee profile data, and more.
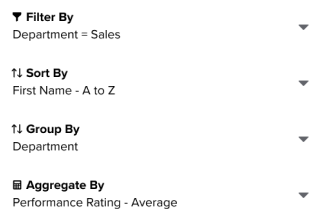
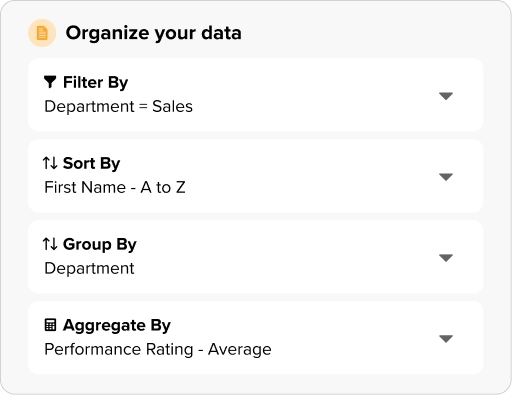
Narrow down your data to the sections that matter most with easy filtering, sorting, row grouping and aggregating.
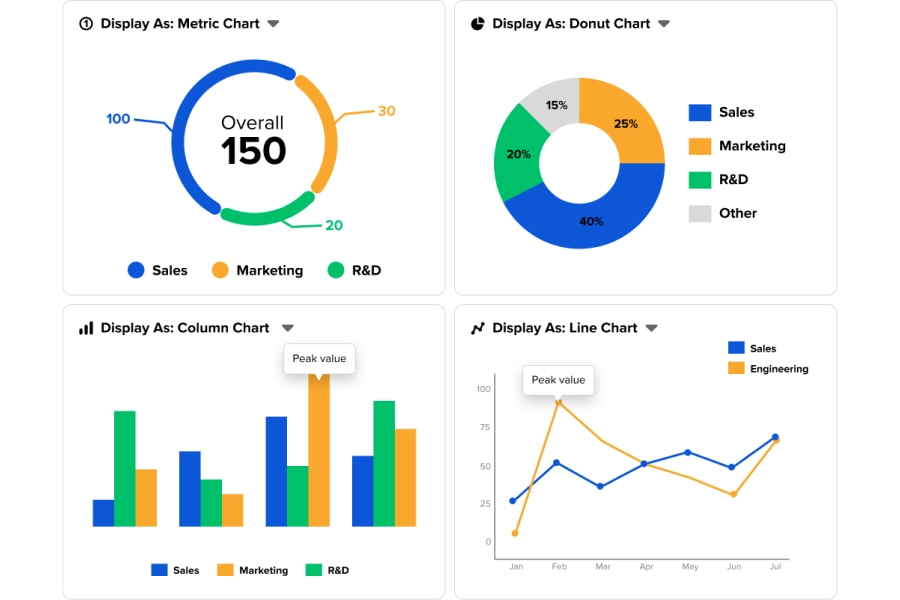
Select from seven chart options to bring your data to life and easily identify trends.
Arrange Your Data Quickly
Create a data-driven HR strategy. With grouping, sorting, and filtering options, you can organize your data so you can easily identify potential issues ahead of time.
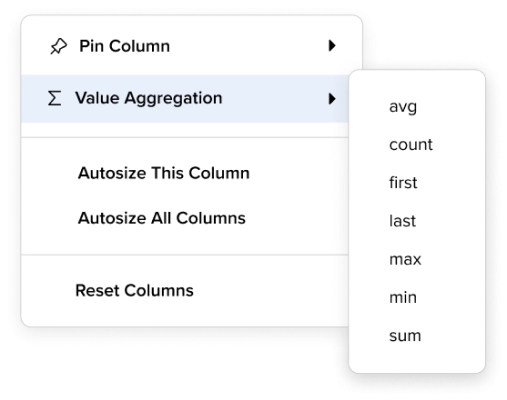
Let Us Do the Math
Quickly apply basic functions to numerical columns like sum, average, minimum & maximum. Go one step further with metric charts to quickly visualize aggregate amounts.
Let Your Data Show Off
Effortlessly turn a spreadsheet into an eye-catching visual presentation. Use line or area charts to quickly identify trends over time, add a pie or donut chart to see proportions at-a-glance, and categorize your data with bar and column charts over time or in one snapshot.
Shine a Light on Your Impact
Be proud of your results and confidently show the value of your HR initiatives. With a deeper understanding of your people and their data, you can easily highlight the impact of your people strategy.
Create reports in minutes to leverage people insights to make strategic decisions for your company.
Performance Over Time
Dig in and understand how your team is doing. Build a report with data from your performance reviews, group the data in the best way for your company, and add a bar chart to see changes over time.
Employee Satisfaction
Check in on how your employees are feeling. Use workflows to get a pulse on employee satisfaction. Report on that workflow and use metric charts to quickly see the averages in each department.
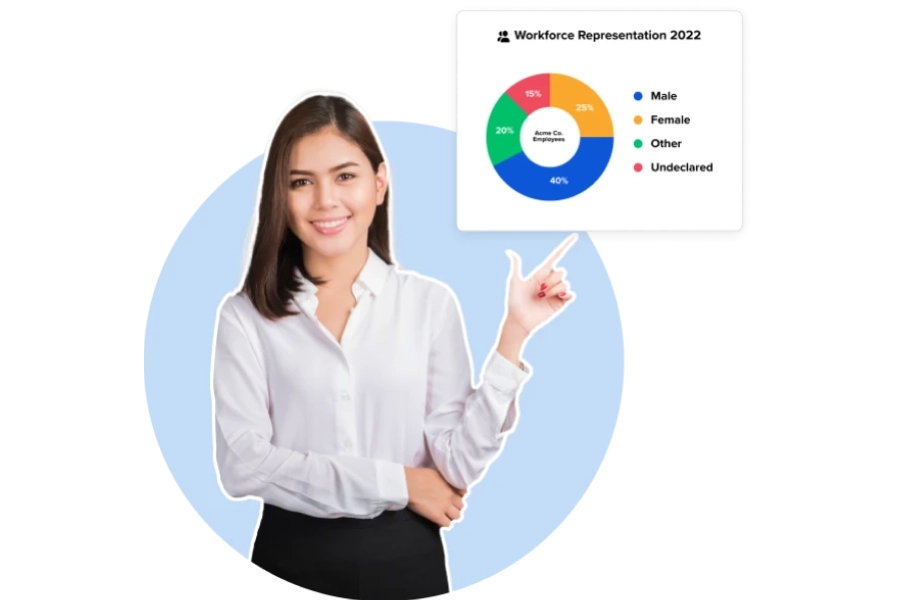
Diversity Breakdown
Want to better understand the diversity in your organization? Use custom fields to collect a few diversity metrics, then create your report and visualize the breakdown with a pie chart.
Termination Reasons
Get a better understanding of your turnover dynamics. Report on termination reasons and use data visualizations to identify trends, areas of improvement, and opportunities to boost retention.
Top-Rated Employee Management Software
Very user friendly not only for the admins but also for the rest of the staff users.
Claudia A.
I looked at a lot of HRIS products before we went with GoCo. The feature set was great and it had everything we needed for our growing company, at a great price point.
Micah K.
Every year [during open enrollment], I would have sleepless nights just trying to get people to finish their paperwork on time. With GoCo, the process is just so much easier.
Robin G.

I think GoCo's biggest shining star is its customer service. It is hard to find reliable customer service, and they are always quick to respond, solution-oriented and friendly.
Mel R.
GoCo helped us improve our relationship with our employees because they started to see that we were taking steps to ensure that they were being treated properly, and that they were receiving the attention that they needed.
Erica R.

Ease of use and clean look. I'm the administrator for my company's GoCo account and it's super easy to get new employees onboarded and enrolled in benefits. We were using digital e-forms for benefits enrollments and I'm so glad to have an automated system for employees to elect insurance!
Jay G.
Join the 10,000+ small and mid-sized US businesses using the GoCo platform.
See How GoCo Can Help HR Shine!
Schedule a Demo →Search...
Product
GoCo
Resources
Articles
eBooks
Webinars
Customer Stories